
Monitoring Azure Kubernetes Cluster with Prometheus and Grafana Complete Setup
In this post, we will go through the process of Kubernetes resource monitoring with Prometheus by installing Grafana and leveraging the Prometheus data source to create information-rich dashboards in a user-friendly visual format.
Prometheus:
Prometheus is a popular open source metric monitoring solution and is a part of the Cloud Native Compute Foundation. Many customers like the extensive metrics that Prometheus provides on Kubernetes.
Following are the key features of prometheus:
- A multi-dimensional data model with time series data identified by metric name and key/value pairs
- PromQL, a flexible query language to leverage this dimensionality
- no reliance on distributed storage; single server nodes are autonomous
- time series collection happens via a pull model over HTTP
- pushing time series is supported via an intermediary gateway
- targets are discovered via service discovery or static configuration
- multiple modes of graphing and dashboard support.
Grafana:
Grafana is an Open Source data visualization tool. We can connect different data sources to grafana and create meaningful, rich dashboard for different workloads. In grafana we can connect different data sources like prometheus, influxDB, Elasticsearch, Azure Monitor etc.
Workflow:
Below is the workflow that we are going to take for the complete setup.

Lets get Started:
Prerequisites:
- Azure CLI installed on the base machine. For installing refer to the link.
- Kubectl is installed. For installing refer to the link.
- Helm is installed. For installing refer to the link.
- Git is installed. For installing refer to the link.
Steps:
- Login to Azure using user account or Service principle. I am using the user account to login to Azure.
az login
For Service Principle
az login --service-principal --username APP_ID --password PASSWORD --tenant TENANT_ID
2. Set the account subscription.
az account set --subscription [subscriptionId]

3. Get AKS Credentials
az aks get-credentials --name [clusterName] --resource-group [resourceGroup]

4. Adding the helm Repository.
 helm repo add stable https://charts.helm.sh/stable
 helm repo update

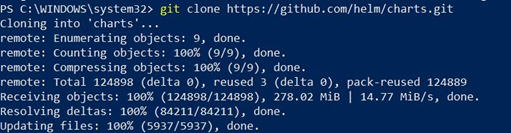
5. Clone the charts for Prometheus and Grafana.
git clone https://github.com/helm/charts.git
6. Create a monitoring namespace.
kubectl create namespace monitoring

7. Go to the clones directory and install the prometheus chart.
Cd charts\stable\prometheus
helm install prometheus stable/prometheus --namespace monitoring
8. Get the pod in Prometheus service and port forward it to 9090.
$POD_NAME=$(kubectl get pods --namespace monitoring -l "app=prometheus,component=server" -o jsonpath="{.items[0].metadata.name}")
kubectl --namespace monitoring port-forward $POD_NAME 9090


9. Prometheus Server is ready now. Check the Prometheus on –127.0.0.1:9090.
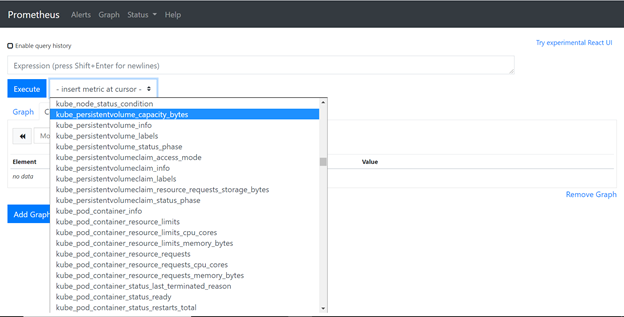
Ist Part of setup is complete.
Grafana Installation
Steps:
- Go to Grafana directory in the cloned repository.

2. Install the Grafana using the helm charts.
helm install grafana stable/grafana -n grafana --namespace monitoring
3. Get the pod in Grafana service and port forward it to 3000.
$POD_NAME=$(kubectl get pods --namespace monitoring -l "app.kubernetes.io/name=grafana,app.kubernetes.io/instance=grafana" -o jsonpath="{.items[0].metadata.name}")
kubectl --namespace monitoring port-forward $POD_NAME 3000


4. Get the password for Grafana dashboard.
kubectl get secret --namespace monitoring grafana -o jsonpath="{.data.admin-password}" | echo

5. Decode the above password to base64 string and then use it for login to Grafana dashboard.
6. By default, username is ‘admin’.
7. Access the Grafana at --> 127.0.0.1:3000
8. Login with ‘admin’ and use the password from the above step.
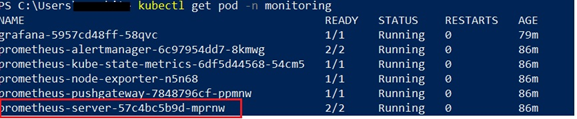
9. Get the IP of Prometheus service running in AKS by executing below commands.
kubectl get pod -n monitoring
kubectl get pod/[Prometheus server name] -n monitoring -o wide

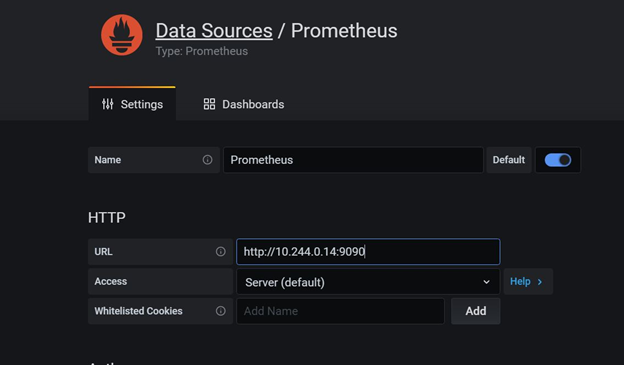
10. After login to Grafana, set the data source as Prometheus for AKS monitoring. In URL provide the IP queried from above step with 9090 port.
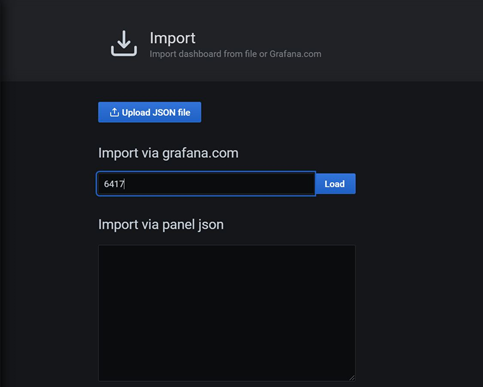
Go to Import dashboard and use Id – 6417 for Kubernetes dashboard and click on load.
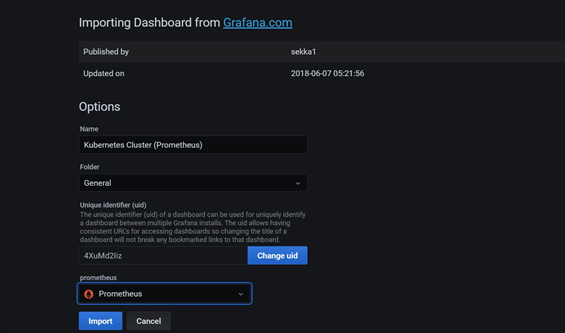
Choose Prometheus as data source and Click on Import.
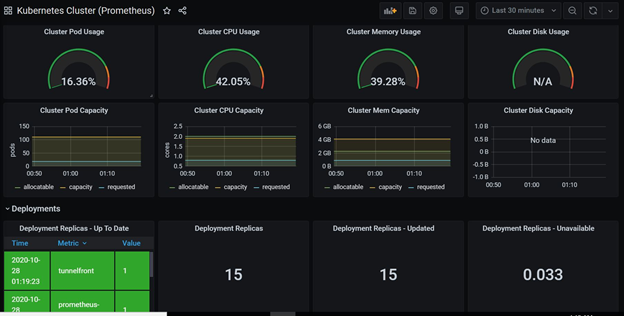
Below Kubernetes dashboard will be created.
Conclusion
In this tutorial, We installed Prometheus, Grafana into your Azure Kubernetes cluster with a standard set of dashboards in Grafana. Grafana allows us to leverage the Prometheus data source and create information-rich graphs in a user-friendly visual format.